Business Intelligence and Data Analysis are a hot commodity in today’s business world , ExcelDynamic Dashboards are the most frequently used method for providing information for this new business trend.
It has a lot of definitions we will say some of them to make it more understandable:
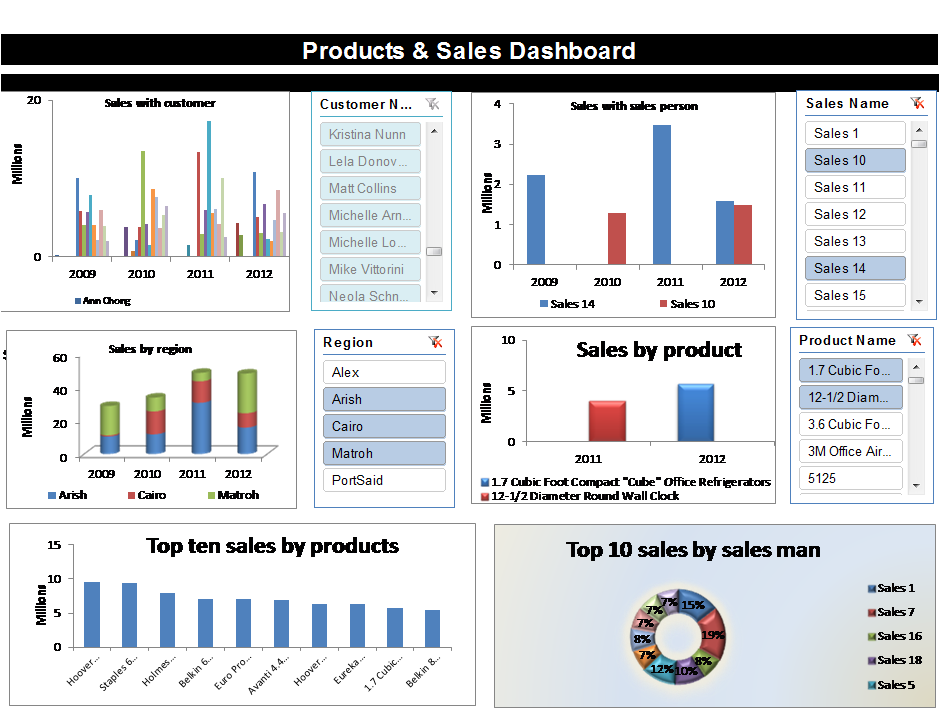
A dashboard is a visual display of the most important information needed to achieve one or more objectives which fits entirely on a single computer screen so it can be monitored at a glance.
Dashboards translate strategy into accountability and measure progress.
It is an easy to read, often single page, real-time user interface, showing a graphical presentation of the current status (snapshot) and historical trends of an organization’s Key Performance Indicators (KPIs) to enable instantaneous and informed decisions
Why Dynamic Dashboard is useful?
It presents data in Visualize, Organize, Summarize and Focus presentation
It is a Quick and Easy to understand data presentation method
With dashboard, user can interact with data and select what he wants to see
What is meant by KPI’s ?
Key Performance Indicators(KPI’s) are measurable values that demonstrate how effectively a company is achieving key business objectives. Organizations use KPI’s at multiple levels to evaluate their success at reaching targets.
Why Excel Dynamic Dashboard is useful?
It presents data in Visualize, Organize, Summarize and Focus presentation
It is a Quick and Easy to understand data presentation method
With dashboard, user can interact with data and select what he wants to see.
Why we use Excel to Create an Excel Dynamic Dashboard?
Excel has a wonderful conditional formatting feature that allows you to have a graphical display within a table.
Excel has different chart types which can adapted to almost any business KPI.
Excel has data tools, pivot table and slicers tools which are help us a lot to create dynamic dashborad.